Scratching your head over the many possibilities to display information in a visual way? The options seem endless, after all. But don’t fret: we are glad to present you with an overview of the differences between several mapping styles, including mind maps, concept maps, system-diagrams, decision trees and flowcharts.
Mind maps
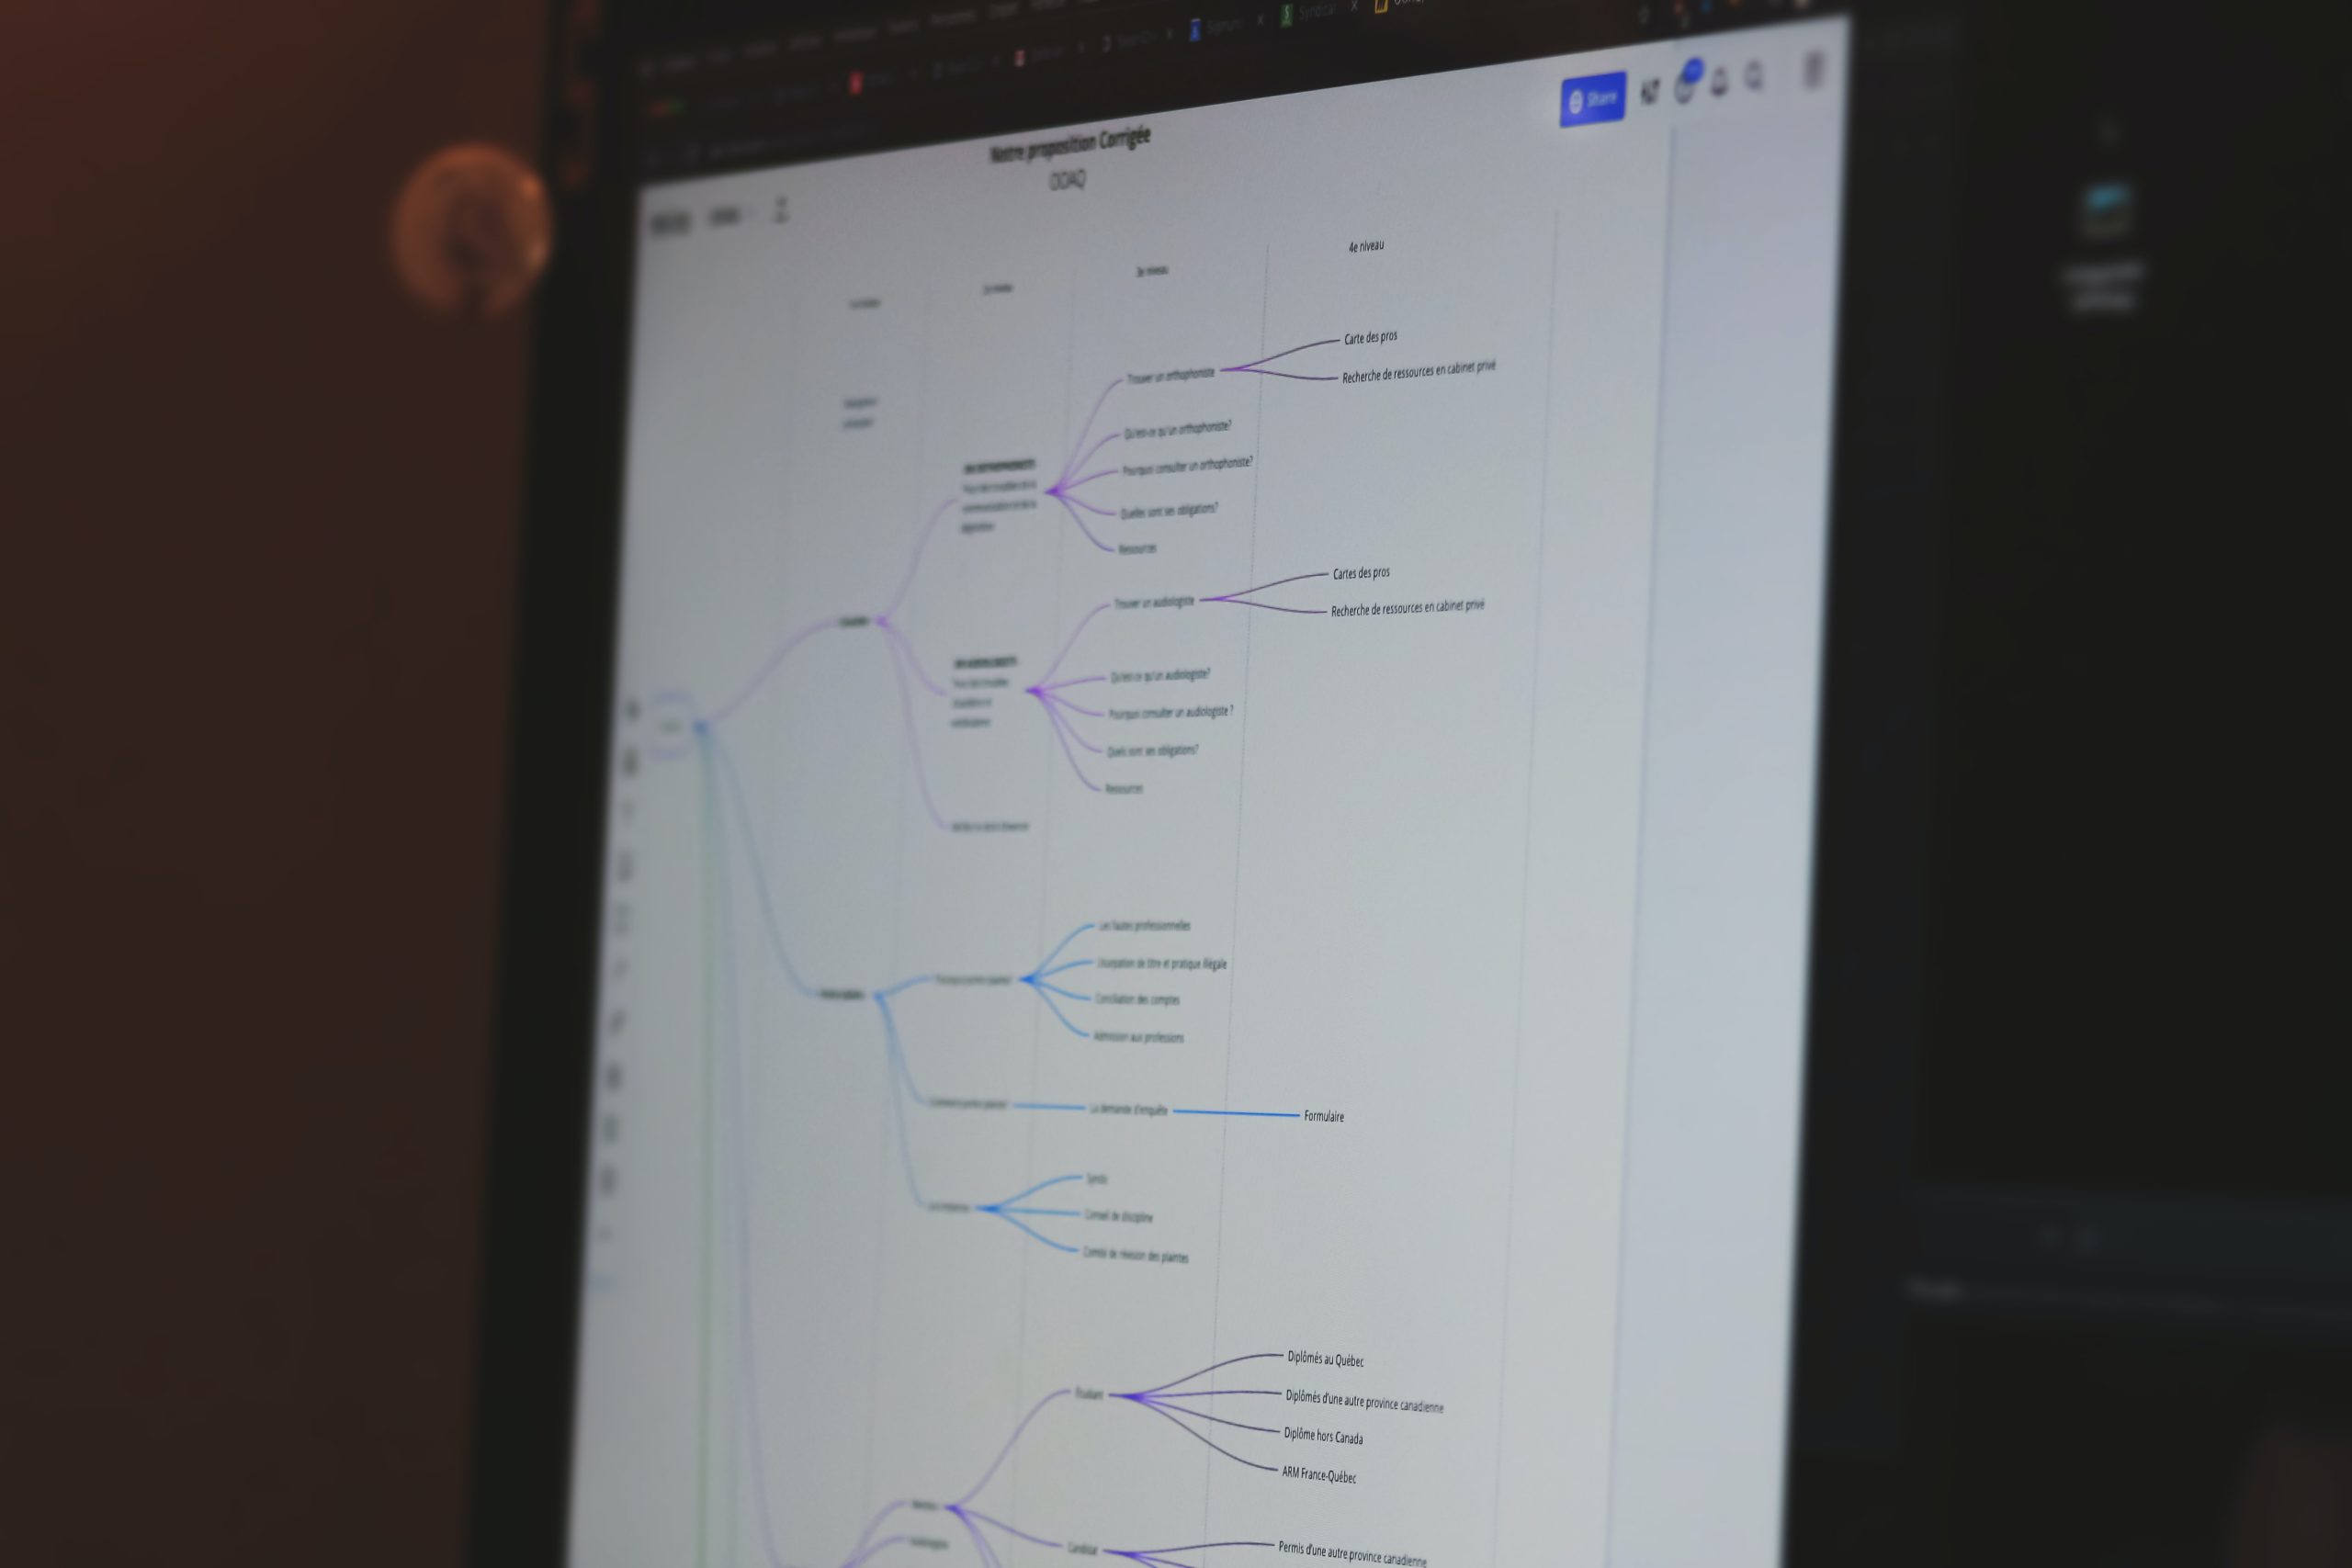
This kind of mapping is familiar to many. Mind maps, a concept that sprouted from the brain of British psychologist Tony Buzan in the 1970s, are diagrams in which a key topic is put in the center. From this central focus point, the information is divided into different topics which spread out. This is done in a branch-like way: from each new stem, new information can emerge. In this way, a structure that looks like a tree emerges. Many mind maps incorporate bright colours and images, and just short keywords and phrases.
We really enjoy mind maps because of their similarity to how our brains work. Mind maps radiate information from a central point. Our minds do that too, according to Buzan. Because of the similar dynamics between our brain’s inner workings and mind maps, it becomes easier to work with them as well as remember their contents. Mind maps thrive on associations and connections between knowledge – just like we do, mentally. Take the following example: when we learn something new about a certain kind of bird, we automatically connect that in our brain to what we already know about birds in general. They fly, they sing, etcetera. This process also takes place when we design our mind map: we link topics to each other, forming a network of knowledge.
Mind maps also facilitate our skill to visualize information mentally. That’s the case because of the array of colours and images incorporated in them. Because of this, we can easily recall the contents of a mind map, unlike what we wrote down in linear notes. Linear note taking takes place when we start from the top of the page and write everything down in chronological order. We’ve written before that we don’t think linear note taking is always the best option available: it puts up a lot of borders, limiting creativity and thinking processes. Mind maps step away from those thinking borders put up by linear note taking.
Buzan’s kind of mapping is suitable for many purposes, such as note taking during meetings and creative processes such as brainstorming.
Use a mind map when:
- You are focusing on one specific topic
- You are working on a non-linear project, such as a brainstorm session
- You want to be able to recall something for a long time through visualizing
Concept maps
Similar in looks but different in meaning from mind maps, that’s how you could describe a concept map. Visually speaking, at first glance concept maps look quite similar to mind maps. However, there are some major differences. Concept maps can connect multiple ideas in one visual, not just one main concept like mind maps do. Additionally, concept maps don’t follow the tree-like, radial structure of a mind map, but rather use a more varied pattern. A mind map shows the branches of a knowledge-tree, while a concept map shows the roots, which are interconnected and build up the rhizomes. Sometimes, concept maps follow a downward structure. Others might prefer a less directed approach, with branches leading everywhere. In that sense, concept maps are much more free than are mind maps. The information in a concept map is depicted with information bubbles or boxes that are labeled. You might also use certain phrases to make clear what kind of connection there is between the boxes.
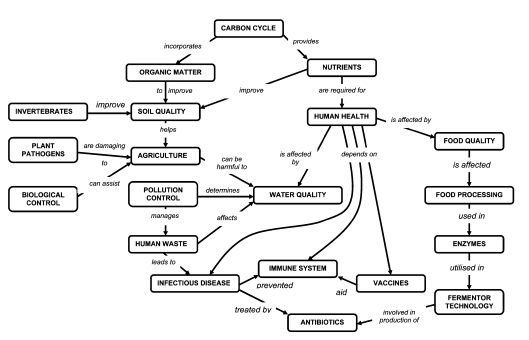
This type of mappings is particularly useful for complex relationships. It helps you to take a step back and see the bigger picture of what you are studying. On the other hand, concept maps also help you to group certain pieces of information together, creating a structure behind your thinking process. This is also called ‘chunking’: breaking information down into groups to create a meaningful set of knowledge. Chunking has been described as a useful technique to improve your working memory’s efficiency.
Concept maps also have great potential for fueling creativity, because just like with mind maps they give you the chance to wander without a mess. The biggest issue with linear note taking is perhaps that it’s a challenge to add new information and thoughts when things are already on your piece of paper. With concept maps, you are free to go ahead and add any concepts at any time of the process.
Use a concept map when:
- You want to incorporate multiple big concepts and get them organized
- You are looking at complex relationships
- When you want more freedom to create a shape than with mind maps
System diagrams
This kind of information visualisation is focused particularly on dynamics between different aspects and portraying large processes. They can look – and be – quite complex, but are more than useful for displaying interactions as well as cause and effect. It can also function as a sort of helping hand in determining where decisions are to be taken in a large-scale process.
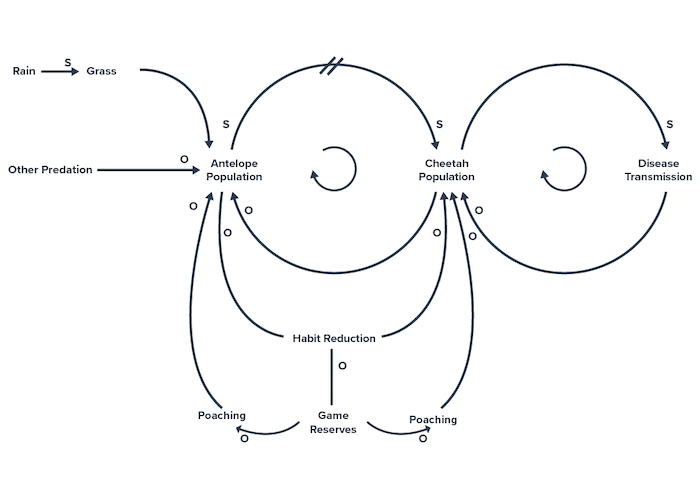
A key element that system diagrams commonly include are ‘feedback loops’. These feedback loops, like a vicious circle, might either reinforce (‘reinforcing loop’) or reduce the impact (‘balancing loop’). Such loops are displayed by circle-like shapes in which one variable affects the other. Feedback loops are key to the creation of system diagrams. We might even choose to display the delay of a feedback loop by slashing the line, something which is not possible with other mapping styles such as concept maps.
Creating a system diagram can be particularly helpful when we are trying to improve a certain situation and want to get a hold of what the current situation looks like. Through system diagrams, we get the chance to not only focus on decisions, but also what influences those decisions, such as attitudes and behaviors. This gives us the chance to take a step back and really examine the process. By looking at all the gears turning, we might determine where changes need to be made. System diagrams also make you aware how cause and effect are separated by many different steps, and that there are always unforeseen consequences.
Use a system diagram when:
- You want to examine dynamics between certain variables
- You are looking to display a complex process
- You want to figure out what kind of decisions/changes need to be made in a process
Decision trees
Decision making can be hard – in particular now that we are in a pandemic where uncertainty is common to many problems. According to Psychology Today, that’s the case because we usually make many decisions based on habit. The change of plans and scenery, however, has taken away our usual daily routines completely:
“Certainty makes it easier to make decisions. But COVID-19 has created lots more uncertainty than certainty.”
The amount of decisions in our life, be it small or large, can be stressful. That’s why it’s important to be mindful about your decision-making process. One such way is to create a decision tree. The name gives away the purpose of this technique: a decision tree is a tool to help make difficult decisions. This is done by analyzing all the potential consequences of decisions you can make. Sometimes, creators of decision trees even add a calculated chance that an event will happen, making it a mathematical project to determine the best outcome.
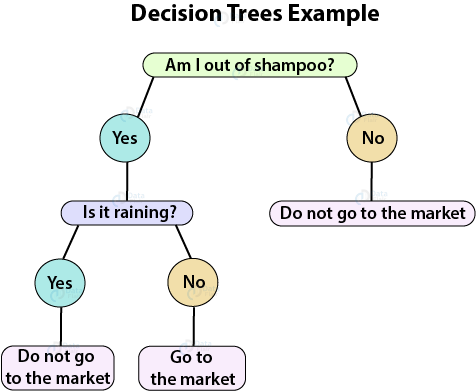
While in usage a bit different from the other mapping styles, decision trees are also a useful way to display information. Let’s take a look at the (very simple) example above. By walking through the steps from top to bottom, we take a sort of test each time until we reach the outcome. In this way, we can easily establish what steps to take – like going to the market for shampoo, since it ran out and it’s not raining right now.
Of course, decision trees are even more useful in complex situations than whether or not you should go out and buy shampoo. They are perfect for situations in which you might need some guidance in seeing what is the best choice, but your mind is clear as mud. Making a decision tree yourself is a great way to balance pro’s and con’s through potential scenarios. You might even weigh different possibilities and to create the best possible decision path. Similar to chunking, decision trees help you to break down choices into manageable pieces of information, making it less abstract.
Use a decision tree when:
- You are having trouble making the ‘right’ decision
- When you want to examine potential outcomes
- You wish to be mindful about your decision-making process to reduce stress
Flowcharts
Like the close connection between mind and concept maps, flowcharts and decision trees are also like distant cousins. Both of these mappings display a certain kind of process in which steps are to be taken. However, while decision trees focus particularly on making choices, flowcharts are commonly used to display a workflow. Still, flowcharts can also include problems which need to be solved. The main difference here is that decision trees are more straightforward: they start out with a single question, not with an event. Additionally, in flowcharts variables have the possibility to flow back to an earlier point in the process.
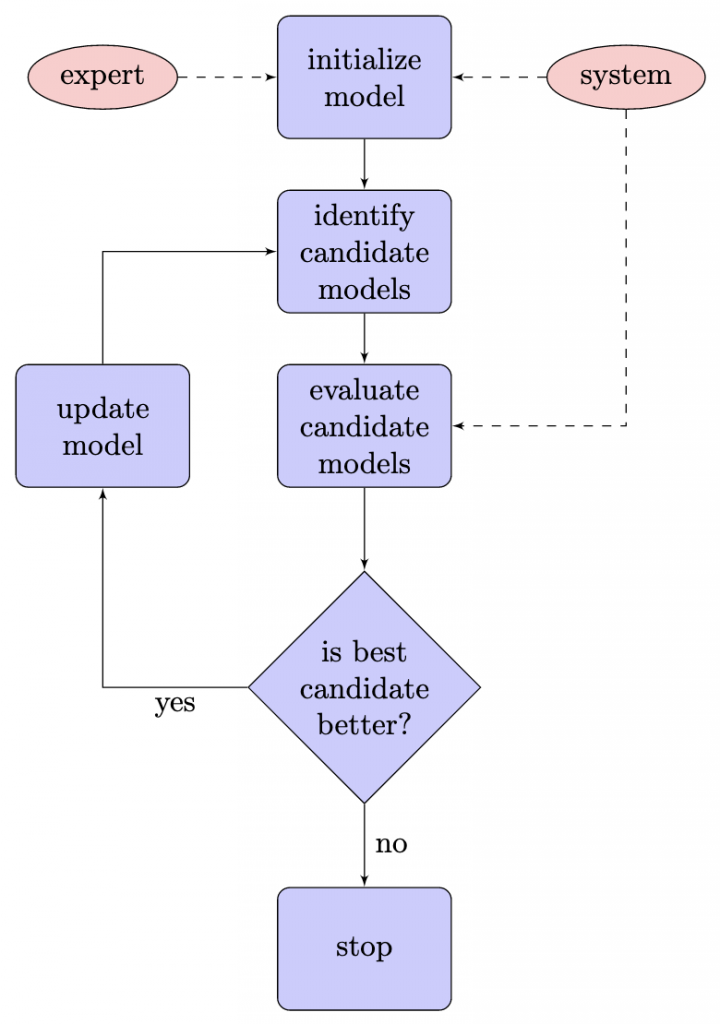
Flowcharts, which are used to visually display a process, contains several steps with a short description of that step. All those steps are linked through arrows, which ‘flow’ in a certain direction. Flowcharts use a common set of symbols to convey meaning, such as a D-shaped box for ‘delay’. This predesigned structure gives you many possibilities to display the process you’re working on.
While they have been around to map (business) processes for about a hundred years, flowcharts are considered very useful. They are great for analyzing complex processes in many different fields, from software engineering to setting up a research survey. That is the case particularly because flowcharts make you see where something could be going wrong and needs to be improved. There have been several different groupings of flowcharts. Author Mark Fryman, for instance, differentiate between the following five flowcharts in his book Quality and Process Improvement:
- Decision Flowcharts
- Logic Flowcharts
- Systems Flowcharts
- Product Flowcharts
- Process Flowcharts
These different flowcharts all focus on a different aspect of a business, making it easier for you to pay attention to the specifics.
Use a flowchart when:
- You want to chart a workflow process
- To study where a process can be improved
The choice is yours
As you see, not all maps are created equally. The choice for a specific type of mapping is ultimately yours. Whatever you end up choosing, try and keep the reason why you would like to create a map in mind.
Sources
- https://blog.bloola.com/digitaler-wandel/concept-map-und-mind-map-was-ist-der-unterschied-0
- https://www.moresteam.com/toolbox/system-diagrams.cfm
- https://hbr.org/1964/07/decision-trees-for-decision-making
- https://www.mindtools.com/pages/article/newTMC_04.htm
- https://www.ayoa.com/ourblog/why-mind-mapping-works-the-benefits-of-mind-mapping/
- https://www.psychologytoday.com/us/blog/the-couch/202007/why-is-decision-making-so-hard-during-pandemic
- https://careerfoundry.com/en/blog/data-analytics/what-is-a-decision-tree/
Feature image: Sigmund.